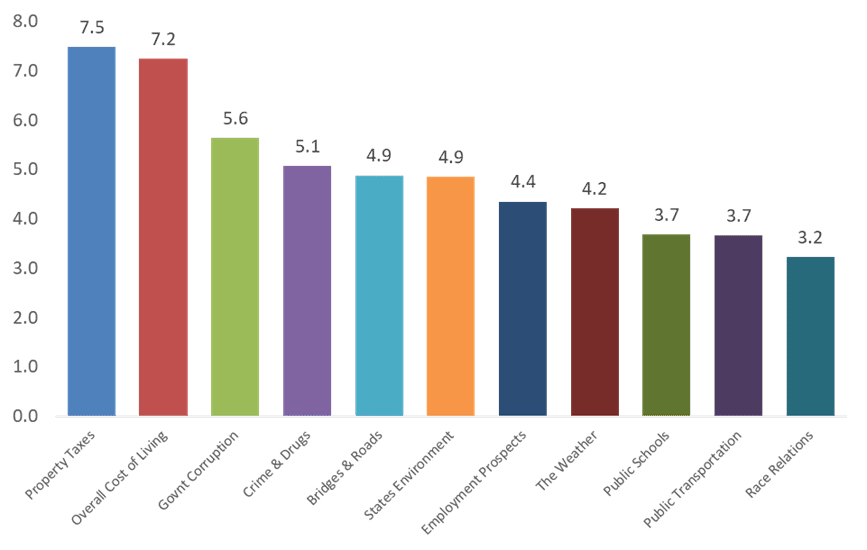
MORRISTOWN, NJ – As New Jersey families gather around the Thanksgiving table many will be having a similar conversation – their plans to leave New Jersey. According to a recent survey conducted for the Garden State Initiative (GSI) and Fairleigh Dickinson University’s School of Public & Global Affairs, 44% of New Jersey residents are planning to leave the state in the not so distant future with more than 1 in 4 (28%) planning to depart the Garden State within 5 years. Unsurprisingly, Property Taxes and the overall Cost of Living were cited as the main drivers. The results also debunk two issues frequently cited in anecdotal accounts of outmigration, weather and public transportation, as they ranked 8th and 10th respectively, out of 11 factors offered.
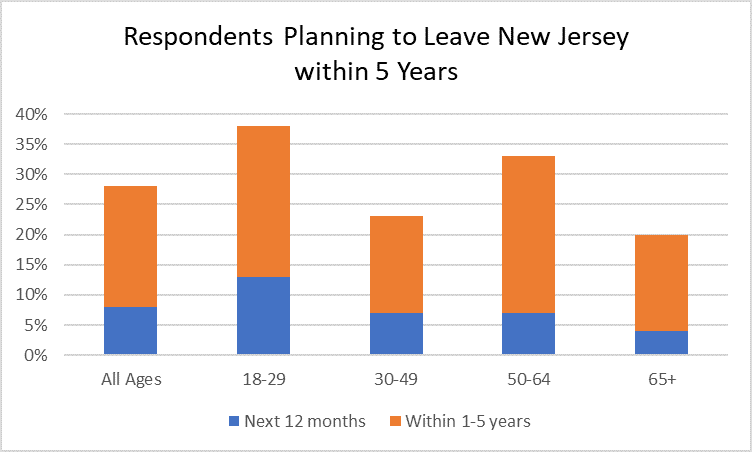
The desire to leave the Garden State was reflected most strongly among young residents (18-29) with almost 40% anticipating leaving the state within the next five years. At the other end of the spectrum, a third (33%) of those nearing retirement (50-64) plan to leave within the next five years.
More broadly, and in spite of our geographic attractiveness, New Jerseyans’ inclination to escape our state doesn’t look much better. 39% of all New Jersey adults indicate they are considering moving out of the state within the next 10 years with an additional 5% indicating they are likely to move after 10 years.
“These results should alarm every elected official and policymaker in New Jersey,” said GSI’s president Regina M. Egea. “We have a crisis of confidence in the ability of our leaders to address property taxes and the cost of living whether at the start of their career, in prime earning years, or repositioning for retirement, New Jersey residents see greener pastures in other states. This crisis presents a profound challenge to our state as we are faced with a generation of young residents looking elsewhere to build their careers, establish families and make investments like homeownership.”
Quality of Life Concerns Ranked
“What’s interesting is that new Jersey’s top two problems are really deeply rooted political problems,” said Peter Woolley, director of FDU’s School of Public & Global Affairs. “That means our big problems can only be resolved through a sustained and resolute political process.”
Respondents to the poll cited property taxes and the high cost of living are the two most concerning issues. When rating concerns on a basis of 0 to 10, these “bread and butter” issues garnered the highest response to a question that surveyed which quality of life indicators are of the greatest concern to New Jersey adults. Government corruption and concerns about crime and drugs rounded-out the top 4 concerns, although at a distance. Of note, the survey found no significant differences in responses across income levels.
About The Garden State Initiative
The Garden State Initiative is a 501(c)3 nonprofit organization dedicated to strengthening New Jersey by providing an alternative voice and commonsense policy solutions in the state — solutions that promote new investment, the growth of businesses, the creation of economic opportunities, and innovation to the benefit of all New Jerseyans. GardenStateInitiative.org
About Fairleigh Dickinson University’s School of Public & Global Affairs
Personal, global and transformational, FDU has an international profile with four campuses in three time zones, two in the Garden State, one in Oxfordshire, England and one in Vancouver, Canada. FDU’s School of Public and Global Affairs prepares students for advancement in public and non-profit leadership offering three elements of education and service: the Master of Public Administration (MPA) for those who want to lead governmental organizations, quasi-governmental agencies, and non-profits; the MA in Global Affairs, offered to diplomatic staff from Argentina to Zambia; and the FDU Poll conducting since 2001 original research for corporate, non-profit, and government entities.
Tables
Methodology
The survey was conducted by live callers on both landlines and cellular phones between September 26 through October 2, 2019, with a scientifically selected random sample of 801 New Jersey adults, 18 or older. Persons without a telephone could not be included in the random selection process. Respondents within a household are selected by asking randomly for the youngest adult currently available. The interview was conducted in English and included 253 adults reached on a landline phone and 548 adults reached on a cell phone, all acquired through random digit dialing.
The data were weighted to be representative of the non-institutionalized adult population of New Jersey. The weighting balanced sample demographics to target population parameters. The sample is balanced to match parameters for sex, age, education, race/ethnicity, region and phone use. The sex, age, education, race/ethnicity and region parameters were derived from 2017 American Community Survey PUMS data. The phone use parameter was derived from estimates provided by the National Health Interview Survey Early Release Program.[1][2][3]
Weighting was done in two stages. The first stage of weighting corrected for different probabilities of selection associated with the number of adults in each household and each respondent’s telephone usage patterns. This adjustment also accounts for the overlapping landline and cell sample frames and the relative sizes of each frame and each sample. This first stage weight was applied to the entire sample which included all adults.
The second stage of the weighting balanced sample demographics to match target population benchmarks. This weighting was accomplished using SPSSINC RAKE, an SPSS extension module that simultaneously balances the distributions of all variables using the GENLOG procedure. Weights were trimmed to prevent individual interviews from having too much influence on the final results. The use of these weights in statistical analysis ensures that the demographic characteristics of the sample closely approximate the demographic characteristics of the target population.
Effects of Sample Design on Statistical Analysis
Post-data collection statistical adjustments require analysis procedures that reflect departures from simple random sampling. We calculate the effects of these design features so that an appropriate adjustment can be incorporated into tests of statistical significance when using these data. The so-called “design effect” or deff represents the loss in statistical efficiency that results from a disproportionate sample design and systematic non-response. The total sample design effect for this study is 1.27.[4]
All surveys are subject to sampling error, which is the expected probable difference between interviewing everyone in a population versus a scientific sampling drawn from that population. Sampling error should be adjusted to recognize the effect of weighting the data to better match the population. In this poll, the simple sampling error for 801 New Jersey adults is +/-3.9 percentage points (including the design effect) at a 95 percent confidence interval. Thus, if 50 percent of New Jersey adults in this sample favor a particular position, we would be 95 percent sure that the true figure is between 46.1 and 53.9 percent (50 +/- 3.9) if all New Jersey adults had been interviewed, rather than just a sample.
Sampling error does not take into account other sources of variation inherent in public opinion studies, such as non-response, question wording, or context effects.
This telephone survey was fielded by Braun Research, Inc. with sample from Dynata.
The sample was purchased from Marketing Systems Group and the research was funded by Fairleigh Dickinson University and the Garden State Initiative.
Weighted Telephone Sample Characteristics
801 New Jersey Adults
Male 48% N = 378 (+/-5%)
Female 52% N = 423 (+/-5%)
18-29 17% N = 143 (+/-8%)
30-49 36% N = 264 (+/-6%)
50-64 26% N = 196 (+/-7%)
65+ 20% N = 198 (+/-7%)
Democrat (with leaners) 46% N = 370 (+/-5%)
Independent 27% N = 196 (+/-7%)
Republican (with leaners) 27% N = 220 (+/-7%)
White 58% N = 534 (+/-4%)
Black 13% N = 90 (+/-9%)
Hispanic 19% N = 111(+/-9%)
Other 10% N = 48 (+/-14%)
Exact question wording and order
LV1 through LV5 released October 11, 2019
US1 through US3 released October 8, 2019
NJ1 and NJ2 released October 11, 2019
HIST withheld
SCHOOLS1 and SCHOOLS2 withheld
RR1 withheld
GS1 In a few words, please tell me what it is about New Jersey that improves the quality of your life:
Record response
GS2 Are you considering a move out of New Jersey in order to improve your standard of living?
1 Yes, within the next 12 months
2 Yes, in the next 1 to 5 years
3 Yes, in the next 6 to 10 years
4 Yes, in the next 11 or more years
5 Not considering a move outside of New Jersey
8 Don’t know (vol)
9 Refused (vol)
GS3 When you think of life in New Jersey, how much, if at all, does the following make you wish you lived somewhere else? Please use a scale of 0 to 10, with 0 meaning it would have no influence on your desire to leave the state, and 10 meaning it is the most influential reason for wanting to leave the state. [Rotate GS1A through GS1L]
GS1A The public school system
GS1B The weather
GS1C The quality and availability of public transportation
GS1D Property taxes
GS1E The state’s environment, such as the quality of its air and water
GS1F The overall cost of living
GS1G The safety and condition of the state’s roads, bridges, and tunnels
GS1H Crime and drugs
GS1I Employment prospects
GS1J Corruption in government
GS1K Race relations
[1] NCHS, National Health Interview Survey, 2013-2017; U.S. Census Bureau, American Community Survey, 2012-2016; and infoUSA.com consumer database, 2013-2017.
[2] Blumberg SJ, Luke JV. Wireless substitution: Early release of estimates from the National Health Interview Survey, July–December 2016. National Center for Health Statistics. May 2017.
[3] Blumberg SJ, Luke JV. Wireless substitution: Early release of estimates from the National Health Interview Survey, July-December 2018. National Center for Health Statistics. July 2019.
[4] The composite design effect for a sample of size n, with each case having a weight, is computed as