-
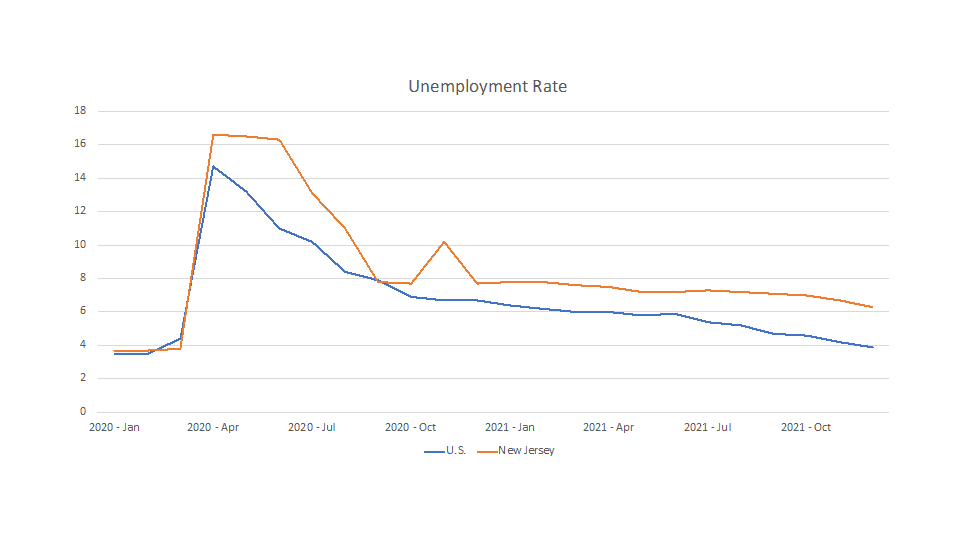
NJ’s December’s 6.3% Unemployment rate 3rd highest in U.S. and remains well above 3.9% U.S. average
-
NJ’s Unemployment rate is highest among neighboring states and in Mid Atlantic region
-
While December 2020-December 2021 set a new record for job increases, a gap of more than 150,000 to pre-pandemic remains
-
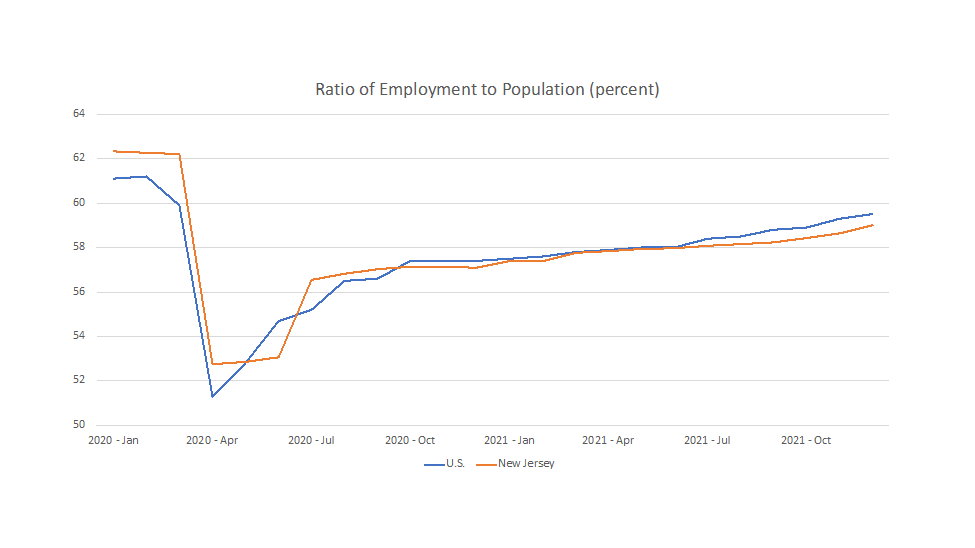
The percent of NJ’s population working was above the US average pre-pandemic but is now below that average
-
NJ’s overall economic recovery has been mixed and progress has been slower here than in many other states
On January 20th, New Jersey’s Department of Labor and Workforce Development issued the monthly jobs report for December 2021 and on January 25th, the U.S. Bureau of Labor Statistics released the State Employment and Unemployment Summary for December 2021, which offers a comparison of how New Jersey is faring compared to other states.
Dr. Charles Steindel, former Chief Economist of the State of New Jersey, analyzed New Jersey’s report for the Garden State Initiative and offered an overview of how the state is faring in its recovery from the pandemic:

New Jersey recorded another month of good job growth in December, with the number of payroll positions increasing by 10,100. This was the 8th straight month that jobs have grown at least 10,000. There was a gain of 208,700 jobs over the course of 2021 (December to December); that beat the old record of 191,700 (set in 1941; pre-war mobilization was a massive spur to the economy. Post-war, the state gained 150,500 jobs over the course of both 1951 and 1983).
Job growth was widespread in December, with Information the only major sector recording a drop. Construction, Manufacturing, and Leisure and Hospitality all had increases of more than 1%. Public-sector employment was little-changed, rising by 700 jobs (on a base of nearly 600,000).
The job numbers are based on a mid-month survey. COVID cases were rising rapidly in that period but were not at the levels seen around the turn of the year. It’s possible, then, that we might see some pull back in the January numbers, but it’s much too soon to make any firm projection on that front.
 Despite the recent surge, New Jersey’s job count is still 153,000 under its February 2020 peak. We do expect a good deal of that gap to be removed when the annual revision of the past data is released with the January count on March 14th but sustained monthly growth will still be needed to pass the previous peak in 2022.
The unemployment numbers were also good, taken in isolation. The unemployment rate fell to 6.3% in December—the lowest rate since March 2020—down from November’s 6.7%. The decline was due to a large rise in household employment more than offsetting a moderate gain in the labor force (the labor force participation rate edged up from 62.8% to 62.9%). While December’s 21,700 increase in household employment was substantially larger than the number for job growth, over the past 12 months the increase in jobs was reportedly a huge 82,600 larger than the gain in employment. The reasons for this differential are quite unclear (the job number is generally considered to be more reliable).
New Jersey’s unemployment rate at 6.3% remains drastically larger than the 3.9% national average. The gap was 2.4 percentage points in December, very little-changed from November’s 2.5.
UPDATE: The U.S. Bureau of Labor Statistics issued its monthly “State Employment and Unemployment” report on January 25th, which offered a detailed comparison of how New Jersey is faring relative to other states. In December, New Jersey’s 6.3% unemployment rate was 3rd highest in the nation, with only Nevada (6.4%) and California (6.5%) faring worse.
NEW JERSEY’S RECOVERY: GOOD, BAD, OR INDIFFERENT?
 The numbers aren’t complete for last year—as noted, the labor market figures will soon be revised, and it will be some months before the fourth quarter numbers on personal income and gross state product are available. Still, we can now take a fair look at 2021 as whole, and how the state has fared since the national recovery started in mid-2020. It’s clear that the state has made some recovery from the massive hit inflicted by COVID, but how do we shape up compared to elsewhere?
The Labor Market: Unemployment Bad, Jobs Good
 Much of the discussion has centered on the unemployment rate. Clearly, although New Jersey’s number has fallen, it remains sharply higher than the nation’s—in November our rate was the 3rd highest. However, the unemployment rate is only one way to look at the health of the labor market. Another measure, which has gained some additional focus in the last decade, is the fraction of the working-age population that is on the job. There too, though, New Jersey has fallen short. We entered the pandemic in February 2020 with a larger share of our population working than the national average. The drop through May 2020 was larger here than elsewhere, and our recovery since has trailed the nation, leaving us with a lower-than-average figure than the nation. This gap—now ½ percentage point—is much less than the unemployment rate gap of around 2 ½ percentage points, but it is further evidence that progress has been slower here than in many other states.
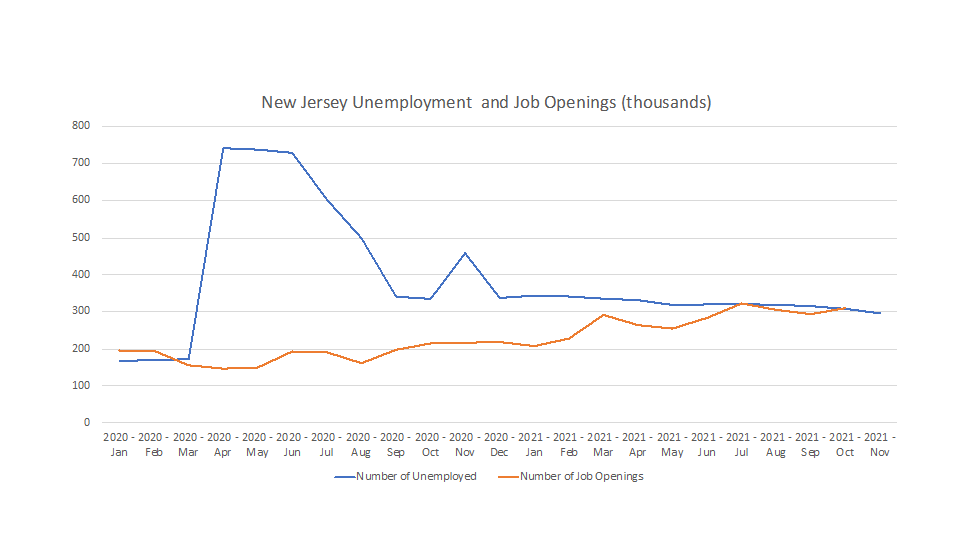
In another set of numbers—job vacancies—New Jersey is also somewhat different than the nation as whole. In contrast to the national figures, the number of available jobs in the state have not been substantially higher than the number of unemployed. This is undoubtedly largely due to our high level of unemployment.
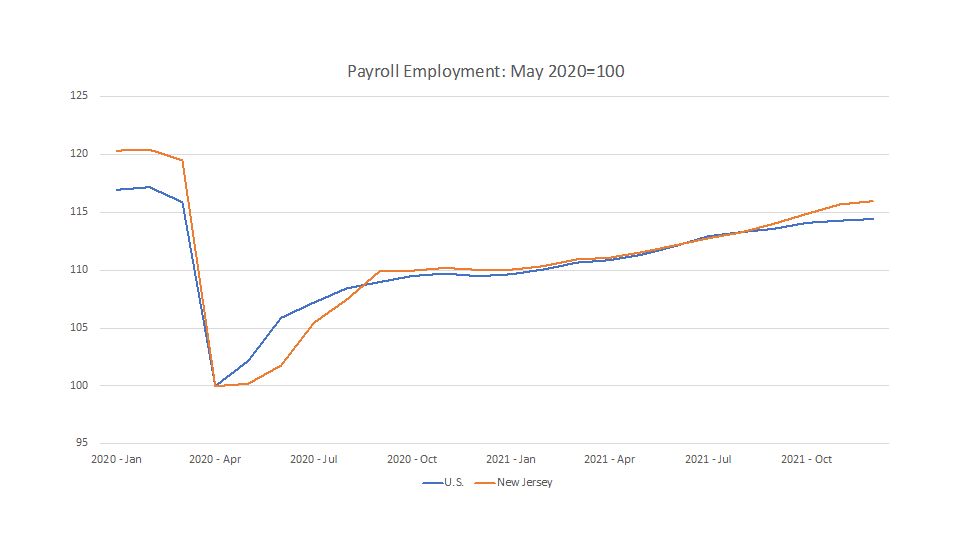 New Jersey’s job picture has been better. We lost nearly 17% of our jobs between February and May 2020, which was a noticeably steeper drop than for the nation. However, job growth since then has been faster than the national average—indeed, information from unemployment insurance tax records suggests that 2021 growth in national jobs has been slightly overstated, and will be revised down a bit, while growth in New Jersey jobs has been noticeably understated, and will be revised up (the national revision will be released in early February, and, as noted, ours in March). However, at least until receipt of the revised data, New Jersey’s gap between the current and previous peak level of jobs (3.7% in December) is still larger than the national average figure (2.3%).
NOTE: This page was updated on January 25th to reflect the release of data for all 50 states by the U.S. Bureau of Labor Statistics.