
-
NJ’s job recovery lags some states in our region and the U.S. as a whole.
-
Unemployment falls 0.1% to 7.2%, well above 5.2% U.S. average, 4th highest in U.S.
-
N.J.’s labor force now 90,000 below last year
-
Jobs lost to pandemic will not be recovered until early 2023 on current trajectory
-
NJ’s labor market has been somewhat softer than the nation but doesn’t stand out in our region
On September 17th, the U.S. Bureau of Labor Statistics released its State Employment and Unemployment Summary for the 50 states and District of Columbia for August 2021. Dr. Charles Steindel, former Chief Economist of the State of New Jersey, analyzed the report for the Garden State Initiative along with the September 16th release of the August New Jersey employment report by the state’s Department of Labor and Workforce Development:
New Jersey gained more than 20,000 jobs in August, continuing a string of good months. Since January monthly job gains have averaged more than 14,000. However, at this pace the state will not reach a new peak until early 2023. Still, New Jersey’s August job gain was quite strong relative to national increase of 235,000, and only three much larger states (California, Texas and New York) and one considerably smaller one (Kentucky) report larger increases.
The August gain was swelled by an aberrant 10,500 increase in government jobs—probably affected by the looming reopening of on-site schooling across the state. The particulars of school hiring can seriously influence government jobs this time of year; last September saw an increase of nearly 24,000 that was essentially reversed in the next two months. Most private sectors saw job gains; the Delta variant apparently did not have major influence on leisure and hospitality, which picked up another 2700 positions.
August’s unemployment numbers were less encouraging. The rate edged down a tick, to 7.2%, staying a full 2 percentage points above the national figure. That places New Jersey is a three-way tie for 4th place, trailing Nevada (7.7%), California (7.5%) and New York (7.4%).
There is an ongoing, fairly large divergence between New Jersey’s job count and the figures on the number of residents employed. Over the 12 months ending in August, jobs are reported to have increased by more than 200,000, while the number of employed residents has risen barely 90,000. The monthly job figures, derived from a fairly large number of employers is considered more reliable (and, indeed, unemployment insurance tax records suggest that the number of jobs in the state are currently being undercounted by more than 50,000).
Also puzzling is the continuing weakness in the state’s labor force, which is reported to have declined by nearly 90,000 over the last 12 months. Without that labor force decline the unemployment rate would be about 2 points higher.
Taking a Broader View on NJ’s Performance
With the exception of New York, New Jersey is experiencing higher unemployment than Pennsylvania, Delaware, and the US overall. While we don’t directly border Connecticut, both states are critically influenced by developments in New York City.
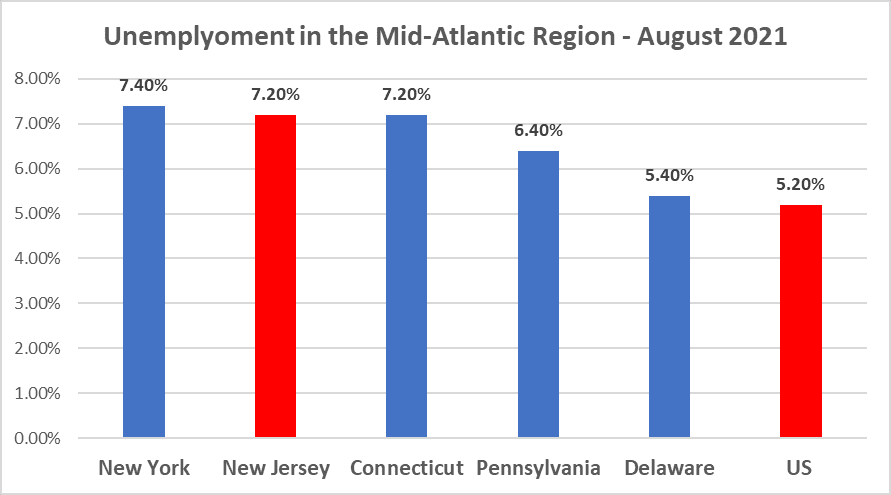
Source: US Bureau of Labor Statistics, 9/21
New Jersey’s job recovery has been less than the nation at large with less than two-thirds of the loss regained, compared to a national figure above three-fourths (though the addition of the fairly larger number of New Jersey jobs not currently being counted should narrow that gap). Our share of jobs regained trails all our neighbors except for New York, but the gaps between us and Pennsylvania and Connecticut are not striking. In general, our job performance while trailing these other states, has fairly well mirrored that of the region.
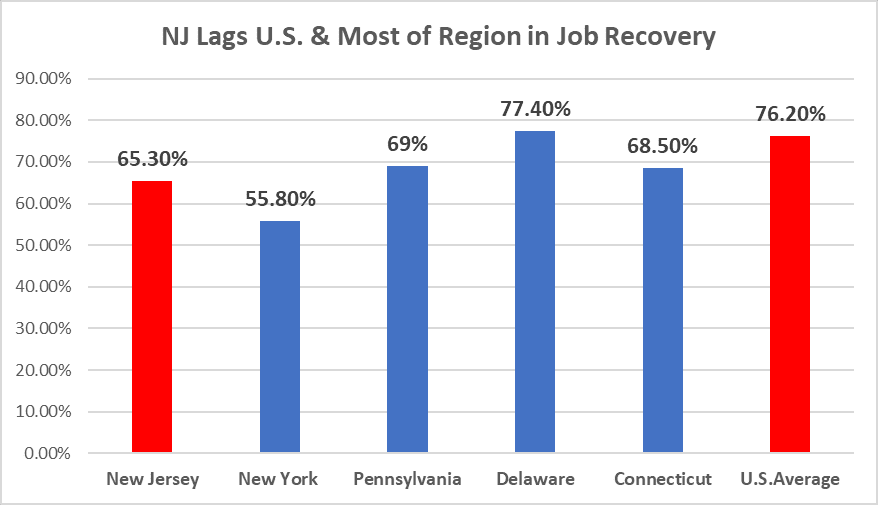
Source: U.S. Bureau of Labor Statistics, 9/21
Looking Back to Early in 2020
During the pandemic recession compared to today, the table at the bottom supports a number of observations:
1) Since the trough, the actual percentage point recovery in New Jersey’s unemployment rate has been comparable to the nation. However, the gap that emerged between New Jersey and the nation has not lessened. New York’s performance has been comparable, and Pennsylvania’s has been roughly similar to ours. Delaware has seen its unemployment rate move more or less in tandem with the nation. Connecticut, which had only a fairly modest rise in its unemployment rate, has seen a very sluggish improvement, and its rate now stands even higher than New Jersey’s. In general, it seems that our unemployment rate path has been fairly typical of the region—the two much smaller states (Delaware and Connecticut) have been the outliers.
New Jersey does stand out with our 16.6% unemployment rate at the start of the downturn as the highest rate in our region. New Jersey’s labor force did not contract as much as New York’s, which helped keep New York’s unemployment rate from rising as much as ours. In Pennsylvania, Delaware, and Connecticut, the decline in resident employment was not as severe as the decline in payrolls.
2) New Jersey’s job loss in the recession was quite comparable to its neighbors, though clearly less dramatic than New York and smaller than Delaware’s. In all five of the states, Leisure and Hospitality was the epicenter of the job loss, shedding at least 50 percent of its jobs in a very brief period. Except for Delaware, all five states shed a larger fraction of jobs than the nation as a whole, with New York especially large.
In sum, it is indeed true that New Jersey’s labor market has been somewhat softer than the nation since the start of the pandemic. However, looking at the neighboring states, it doesn’t seem that we stand out in that regard.
The table shows the total decline in jobs from the peak to trough month (February to April for New Jersey, New York, and Delaware; January to April for Pennsylvania and Connecticut), the recovery since and the swing in the unemployment rates in the downturn (February to April for New Jersey: January-April for New York Pennsylvania, and Delaware: and February-May for Connecticut).
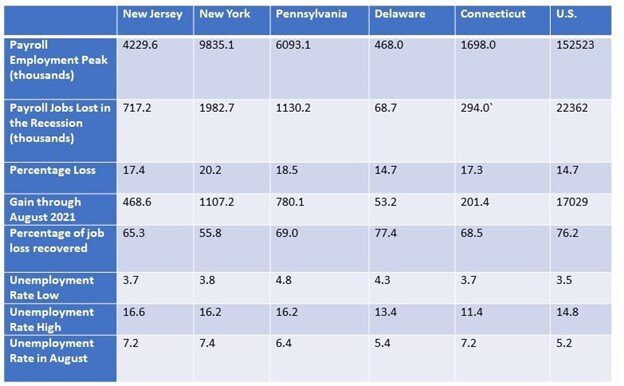
Source: US Bureau of Labor Statistics, 9/21