

New Jersey governments—state and local—issue many financial reports, seemingly each with its own idiosyncratic reporting standards and jargon. Perhaps the broadest of these is the suitably named Comprehensive Audited Financial Report (CAFR), issued by the Treasury Department’s Office of Management and Budget. This report describes in detail the financial position of the state government; local governments and school boards are not included.
The latest CAFR, covering fiscal year 2024 (https://www.nj.gov/treasury/omb/publications/24fr/NJFRFY2024Complete.pdf) is a whopping 412 pages long. States produce such documents in part to meet the demands of investors and raters of state debt. OMB takes pride in their product. New Jersey’s CAFR regularly receives a “Certificate of Achievement for Excellence in Financial Reporting” from the Government Finance Officers Association.
Although our CAFR is a respected document, it is not one for the faint of heart, unschooled in the peculiarities of government accounting, to use. Fortunately, recent legislation requires the State Auditor to report on the financial condition of the state, and the office has done that by preparing a plain language summary of the CAFR., with some additional material comparing New Jersey’s statistics with those of our neighbors. The Auditor’s 42-page (barely a tenth the length of the CAFR) report can be found at https://pub.njleg.state.nj.us/publications/auditor/2025/95030224.pdf; what follows is a summary and discussion of the Auditor’s summary.
The document has four major sections: I. An overall view of the state’s financial data—assets, liabilities, revenue, expenditures—over the last few years. II. A tabulation of the money held by the major state funds at the end of recent fiscal years. III. A report on the revenues and expenditures of the major state funds in recent fiscal years. IV. A statistical section primarily consisting of major economic data for New Jersey and other northeastern states. The document is extremely useful for anybody wishing to get a broad view of state finances over time and in comparison to our neighbors.
State Liabilities Remain Massive, Largely Reflecting Pension and Benefit Burdens
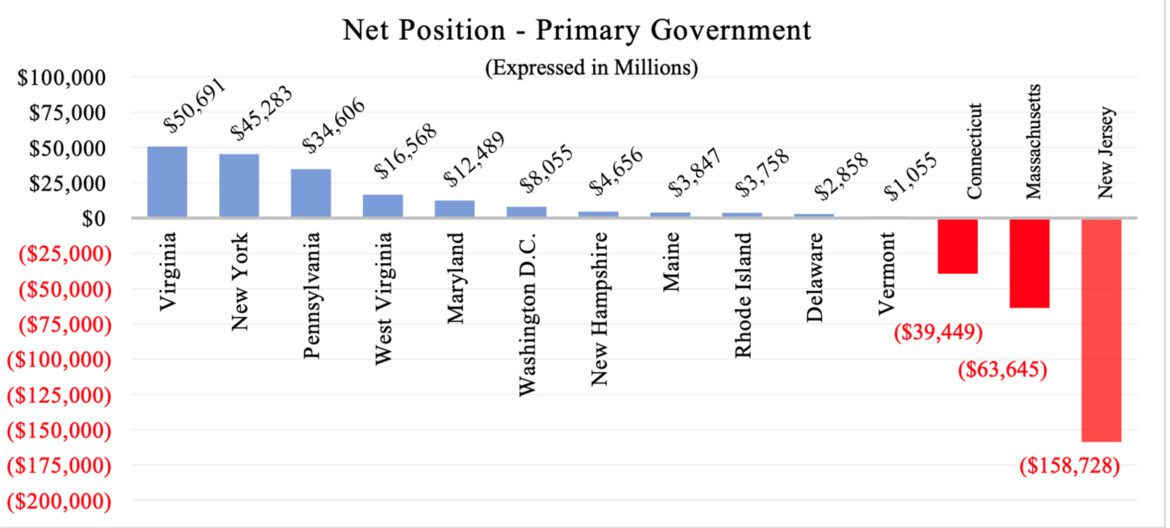
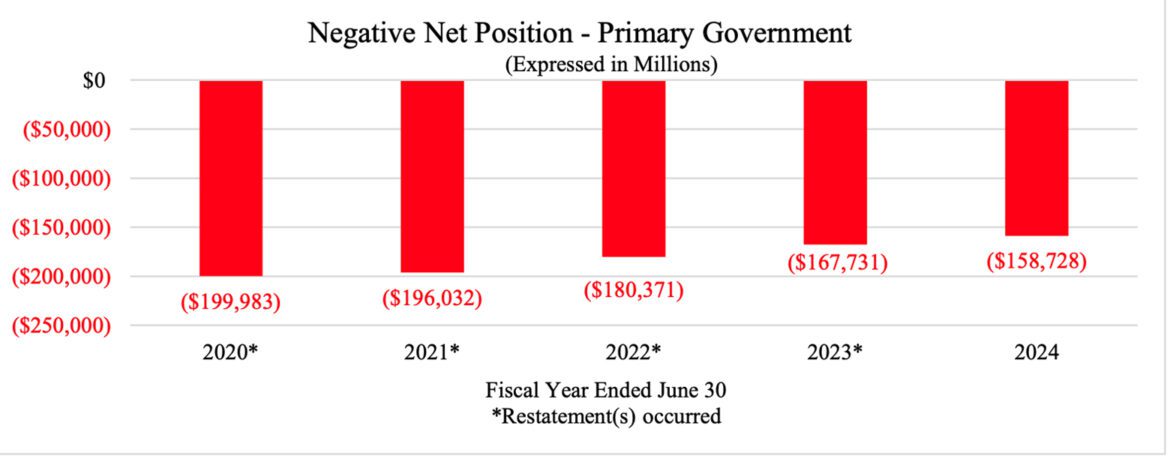
One of the key sets of charts is on page 9, showing how the “Net Position” (state government assets less liabilities) of New Jersey has evolved, and how it compared at the end of fiscal year 2024 to other states. The raw number for the end of 2024 looks awful: -$158.7 billion, which is equal to about $17.000 for every state resident. This is more than twice as high as Massachusett’s -$63.6 billion (Connecticut is the only other Northeast state with a negative “Net Position”). But perhaps some solace may be found from observing that New Jersey’s position has improved fairly substantively from 2020’s -$200 billion.
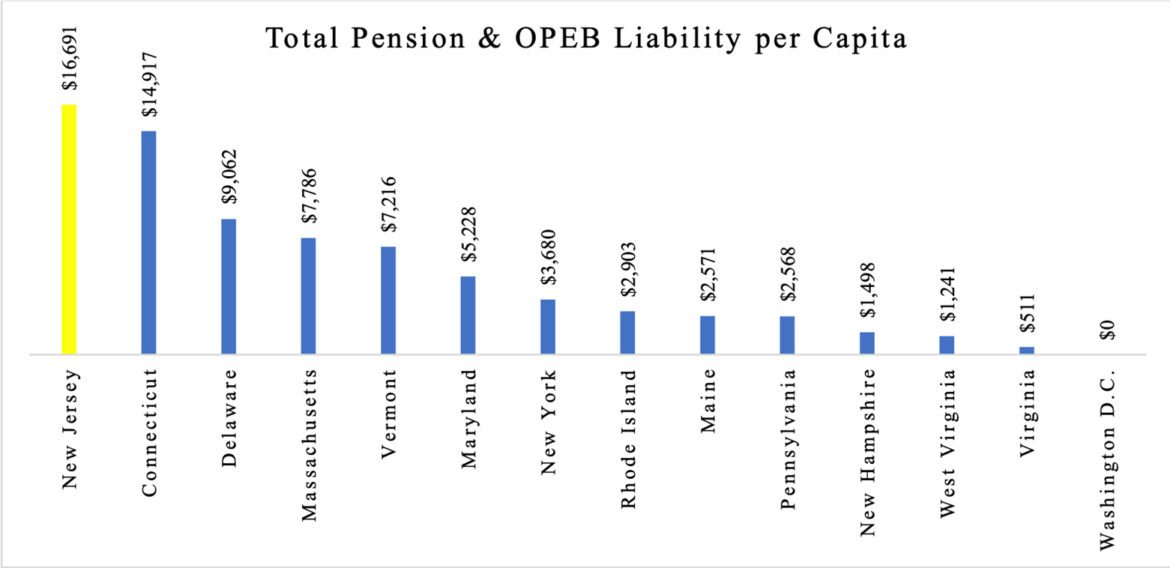
New Jersey is reported to have had at the end of fiscal 2024 $201 billion in obligations. Less than ¼ of that amount was bonded debt. The balance is primarily estimates of the unfunded liability of the pension funds and the “OPED” (other public employee benefits) liability (mainly employee and retiree medical benefits). The two are each more than $75 billion.
The report compares the nonbonded liabilities of New Jersey to other Northeastern states. We come off the worst in both categories, both in total and per capita. In New Jersey’s case the pension liability applies for essentially all public employee plans; in other states there are plans administered at lower levels of government. It’s unlikely that folding in the numbers for all the public plans of the other states would change our worse performance, but if that were done the gap may be narrower.
State Revenues and Expenditures
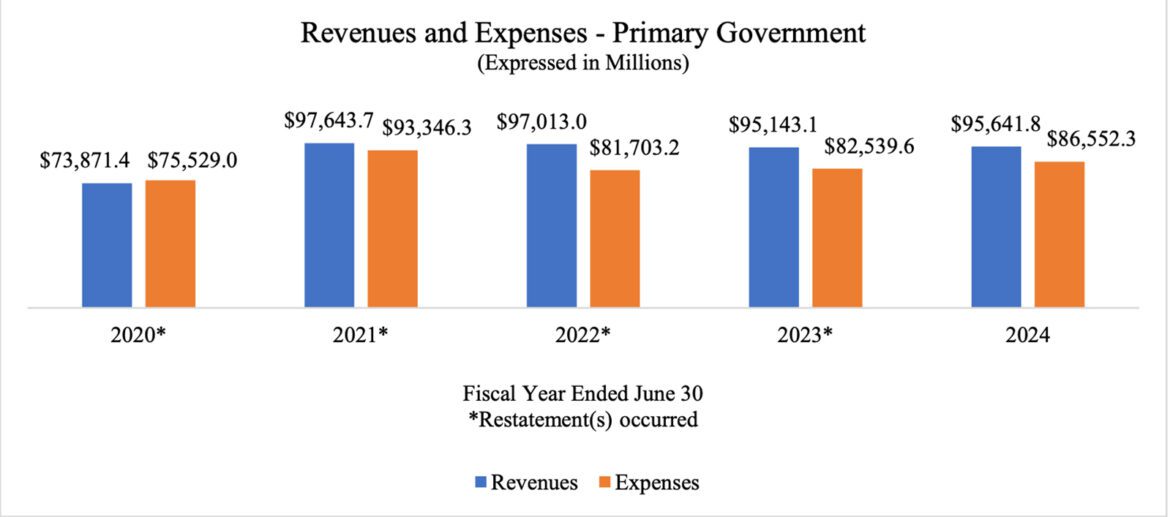
The section I information on revenues and expenses of the state raise an interesting but undiscussed issue: the report shows that for every year from 2021 through 2024 state government spending was substantially less than revenue. This seems at major odds with the usual budget reports that the state’s undesignated cash surplus has recently dropped. The figures reported for both revenues and expenses are very much higher than the numbers shown in the state budget. Much of the difference probably reflects state activities funded by the Federal government, which are outside the normal appropriations process, but some explanation would be welcome.
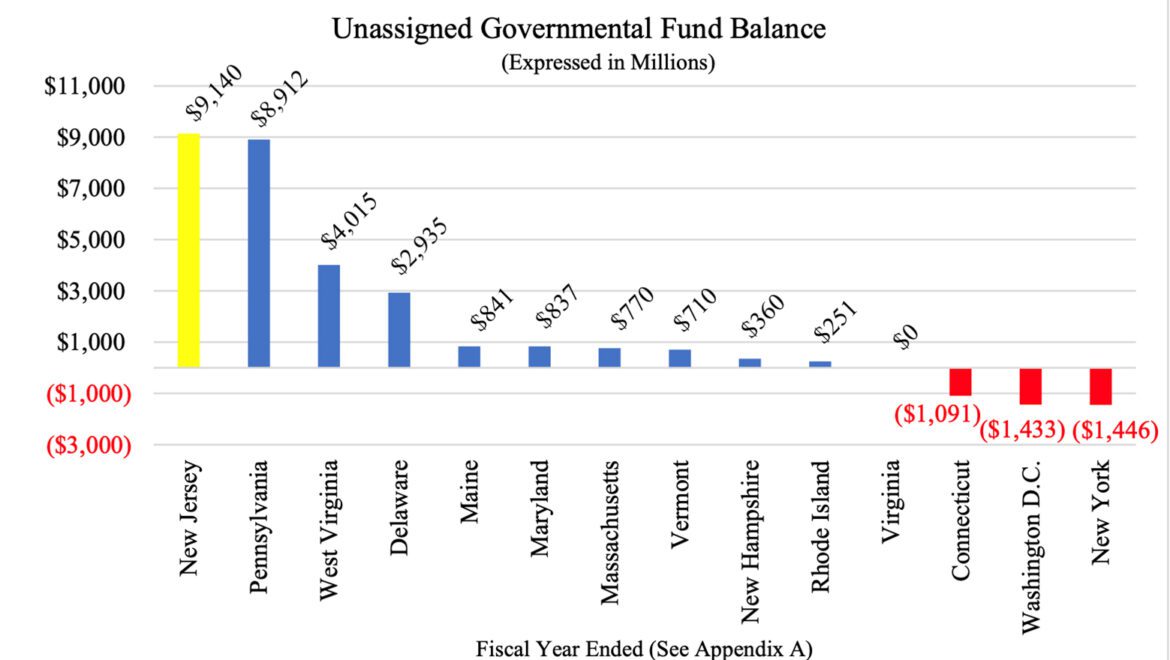
Section II on the position of state funds reports one bright spot: At the end of fiscal year 2024 New Jersey had the largest unassigned fund balance of any Northeastern state! But budget documents show that balance shrunk some in fiscal year 2025, and the Governor’s budget proposal estimates there will be some more shrinkage in fiscal year 2026.
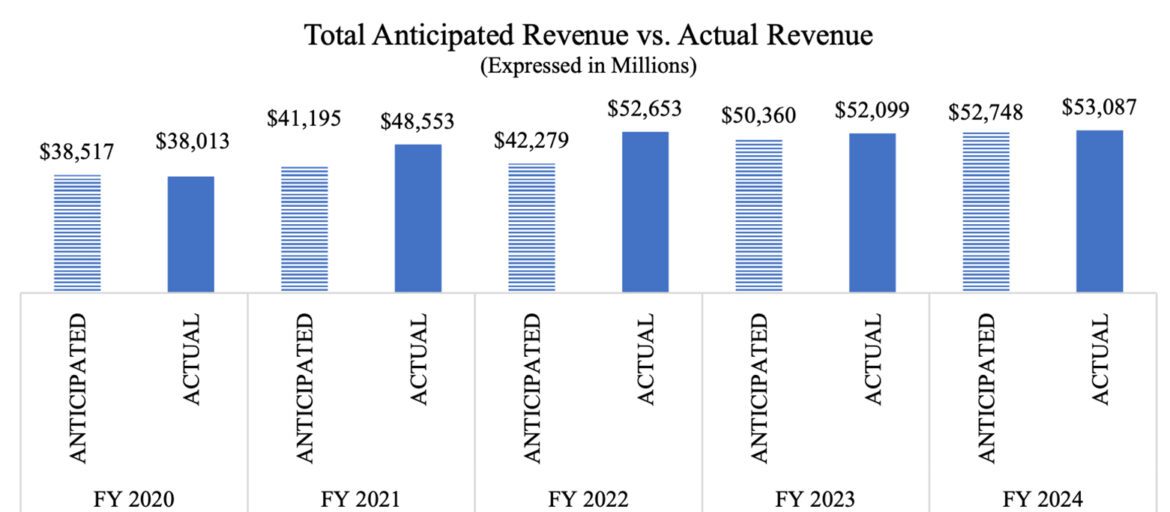
In the Section III discussion of the state budget there is a comparison of “anticipated” and “actual” revenue for recent fiscal years. The “anticipated” revenue figure is the amount the Governor “certifies” in the Appropriations Act, while the actual is the amount actually collected. The differences are typically fairly small, but in fiscal 2021 actual revenue was much larger—not mentioned, but largely reflecting the emergency debt issue during the pandemic—and in fiscal 2022 there was a large, unexpected, revenue surge.
New Jersey’s Economy: Middle of the Pack Compared to Peers
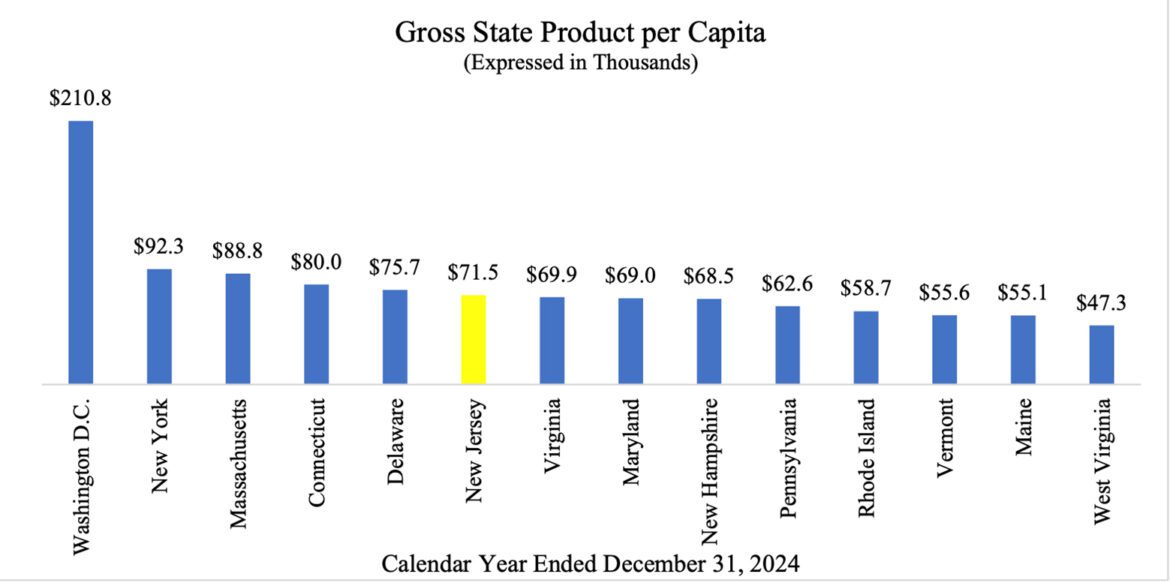
Section IV shows the trends in some major New Jersey statistics: population, unemployment, and real Gross State Product (GSP), with some comparisons to the other Northeastern states. While New Jersey’s aggregate GSP is third-highest in the region (behind only New York and Pennsylvania) on a per capita basis we are more in the middle of the pack: well under New York and Massachusetts (the extraordinary figure for DC—more than twice as high as New York—reflects the very unusual circumstance of the city, which has more workers than residents). The relatively low figure for New Jersey may look surprising, considering that we are typically very near the top of the nation for income per capita or per household. The explanation is that much of the income of New Jersey residents is earned from working in New York, adding to New York output, but not New Jersey’s. The US Bureau of Economic Analysis estimates that in 2024 the difference between the income New Jersey residents earned out of state (surely mainly in New York) and the income out of state residents earned in New Jersey was more than $85 billion, which was equal to 10% of New Jersey’s (current-dollar) GSP. In a sense, the residents of New Jersey are richer than the state’s economy would suggest. High income people, unsurprisingly, tend to demand high quality, costly, public services. But in our case those services must be financed by means that are unusually costly for the state’s economy. In my view, failure to recognize this fundamental issue is the ultimate, underlying, cause for many of the problems New Jersey state finance has had in the last generation. Our economy is not large enough to readily finance everything that is desired, and expedients—on the spending and on the revenue side–are resorted to when the pressures become intense. Many of these expedients have persisted and tend to become distorting (for instance, unusually high tax rates at the top playing some role in spurring outmigration), imposing costs on the state’s economy.
While limitations of some of the items and discussion presented have been noted here, on balance this report is a remarkably good document, illustrating the ongoing challenges the state faces, and documenting that we continue to trail our neighbors. The State Auditor deserves praise for it, and future editions will be eagerly awaited. All those interested in New Jersey state finances should have it available.