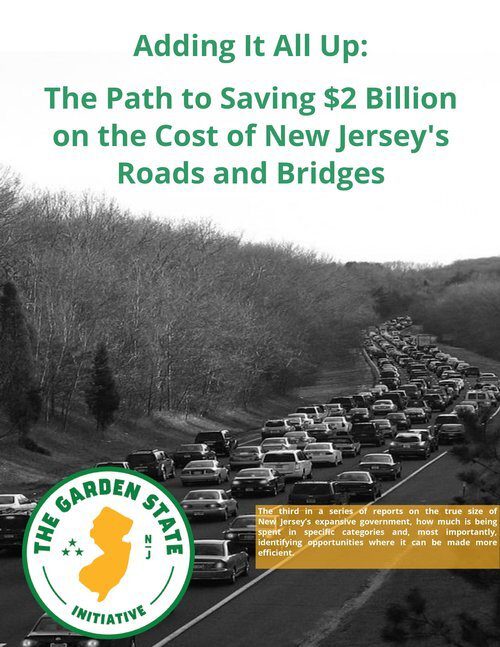
 Garden State Initiative (GSI) today released Adding It All Up: The Path to Saving $2 Billion on the Cost of New Jersey’s Roads and Bridges, which includes recommendations based upon a data-driven analysis of our investments in our state’s roads and bridges. Third in a series of reports on the true size of New Jersey’s expansive government, this report identifies $2 billion in savings that can be reinvested for tangible improvements to our state’s infrastructure.
Despite having infrastructure that is rated D+ by the American Society of Civil Engineers, New Jersey has among the most expensive road and bridge networks in the country, and according to many ways of calculating it, THE most expensive. In 2016, $16 Billion of transportation spending was authorized to fund New Jersey’s Transportation Trust Fund (TTF) for 8 years through the 23-cent increase in the state’s Gas Tax. In 2018, the current Administration increased the gas tax another 4.3 cents to ensure that funding source remained stable. According to the recent Fairleigh Dickinson University Poll however, a third of all adults say the quality and safety of New Jersey’s roads, bridges, and tunnels is getting worse. And when it comes to how to pay for road, bridge, and tunnel improvements,” few say the state needs to raise more money. Instead, 83 percent believe legislators should do a better job spending what they already have.” GSI couldn’t agree more.
“New Jersey residents are paying more than ever in taxes to maintain and modernize our network of roads and bridges,” stated GSI’s president Regina M. Egea. “The public is rightfully demanding an accounting of how their money is being spent and deserve a better return on their investment. New Jersey is an outlier, outspending our peer states by significant margins, while our infrastructure is not perceptively improving. This report demonstrates how transportation funds can be put to work more efficiently and, as a consequence, then pay down TTF’s debt more quickly, improve our infrastructure and ultimately reduce our tax burden.
Summary
When adjusted for the state’s population density and general costs of doing business, the results of this analysis shows that New Jersey far outspends 7 peer states in the Mid-Atlantic/New England region when it comes to core transportation services per state-controlled lane mile. New Jersey spends over $238,000 per state-controlled lane mile, the highest among the states analyzed. The next expensive state, Massachusetts, spends only approximately $197,000 per lane mile.
If New Jersey spent on par with the second best among the peer group, Delaware, taxpayers would save $1.5 billion; spending on par with the leader, Pennsylvania, would save $2 billion or 20% annually.
Cost Savings Strategies and Recommendations
Three common-sense strategies, employing best practices from other states, are detailed in this report and offer a path to achieve significant savings for taxpayers and provide funds for additional investments in modernizing our infrastructure:
1. De-layering and consolidation of services as implemented in Massachusetts. The savings largely derive from reductions in employee benefit costs (all employees were merged into the state’s cheaper and far larger Group Insurance Commission), lower borrowing costs, administration function consolidation, and operational efficiencies. Since inception in November 2009 and up to FY15 the Commonwealth reports the reform has saved over $525 million.
2. Private Public Partnerships (P3s) as utilized in Illinois, Indiana, and Pennsylvania. Pennsylvania’s $1 billion Rapid Bridge Replacement Program, which competitively selected a private firm to replace over 550 structurally deficient bridges and maintain them for decades. The P3 is nearly ten years ahead of schedule of what a traditional public project delivery system would have allowed for and the projected annual maintenance cost for each bridge is $10,000—40 percent less than if Pennsylvania’s Department of Transportation remained responsible for maintenance.
3. Modernizing project planning, budgeting, and scoring as implemented in Virginia, via Smart Scale, a scoring dashboard dedicated to picking the right transportation projects for funding and ensuring the best use of tax dollars. The dashboard ultimately leaves the statewide transportation entity, the Commonwealth Transportation Board, with discretion over projects, but requires that the Board defend and document any changes from what Smart Scale recommends. Smart Scale’s detractors are, unsurprisingly, those projects and areas that don’t happen to receive an allocation for a given year.