Transportation, GOVERNMENT THAT WORKS
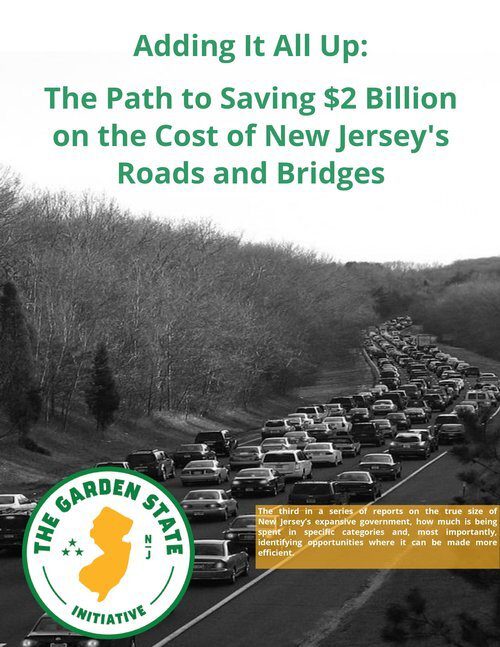
Adding It All Up: The Path to Saving $2 Billion on the Cost of New Jersey’s Roads and Bridges
August 7, 2019
Click above to view the report
The third in a series of reports focusing on the true size of New Jersey’s expansive government, how much is being spent in specific categories and, most importantly, identifying opportunities where it can be made more efficient.
Adding It All Up: The Path to Saving $2 Billion on the Cost of New Jersey’s Roads and Bridges includes recommendations based upon a data-driven analysis of our investments in our state’s roads and bridges. This report identifies $2 billion in savings that can be reinvested for tangible improvements to our state’s infrastructure.
Key findings from the report are:
-
When adjusted for the state’s population density and general costs of doing business, the results of this analysis shows that New Jersey far outspends 7 peer states in the Mid-Atlantic/New England region when it comes to core transportation services per state-controlled lane mile. New Jersey spends over $238,000 per state-controlled lane mile, the highest among the states analyzed. The next expensive state, Massachusetts, spends only approximately $197,000 per lane mile.
-
If New Jersey spent on par with the second best among the peer group, Delaware, taxpayers would save $1.5 billion; spending on par with the leader, Pennsylvania, would save $2 billion or 20% annually.
-
Three common-sense strategies, employing best practices from other states, are detailed in this report and offer a path to achieve significant savings for taxpayers and provide funds for additional investments in modernizing our infrastructure:
1. De-layering and consolidation of services as implemented in Massachusetts. Since inception in November 2009 and up to FY15 the Commonwealth reports the reform has saved over $525 million.
2. Private Public Partnerships (P3s) as utilized in Illinois, Indiana, and Pennsylvania. Pennsylvania’s $1 billion Rapid Bridge Replacement Program, which competitively selected a private firm to replace over 550 structurally deficient bridges and maintain them for decades. The P3 is nearly ten years ahead of schedule of what a traditional public project delivery system would have allowed for and the projected annual maintenance cost for each bridge is $10,000—40 percent less than if Pennsylvania’s Department of Transportation remained responsible for maintenance.
3. Modernizing project planning, budgeting, and scoring as implemented in Virginia, via Smart Scale, a scoring dashboard dedicated to picking the right transportation projects for funding and ensuring the best use of tax dollars. The dashboard ultimately leaves the statewide transportation entity, the Commonwealth Transportation Board, with discretion over projects, but requires that the Board defend and document any changes from what Smart Scale recommends. Smart Scale’s detractors are, unsurprisingly, those projects and areas that don’t happen to receive an allocation for a given year.