Unemployment, TRANSFORMING OUR BUSINESS CLIMATE, Labor
GSI Analysis: Nov. ’21 NJ Jobs Report: Despite Ongoing Jobs Growth, NJ Continues to Lag U.S. Decline in Unemployment

-
Unemployment declines to 6.6%, still well above 4.2% U.S. average
-
November is third straight month with a gain above 20,000 jobs
-
NJ’s stagnant labor force size is below 2008 average
-
U.S. data shows high cost of living diminishes income for many residents
On December 16th, New Jersey’s Department of Labor and Workforce Development issued the monthly jobs report for November 2021. Dr. Charles Steindel, former Chief Economist of the State of New Jersey, analyzed the report for the Garden State Initiative:

New Jersey gained 25,800 jobs in November (27,000 in the private sector) and October’s increase was revised up to nearly 30,000. So far this year the state’s job count has increased by almost 200,000. We are still about 170,000 jobs under the February 2020 peak, but with continued gains and the likelihood that the number has been understated, there now appears a reasonable chance a new peak could be reached next year.
All private sectors except construction saw job growth. The largest ones were in trade, transportation, and utilities (up 8,500—close to 1%), professional and business services (8,600—more than 1%), education and health services (4,200) and leisure and hospitality (2,400). Manufacturing, information, and finance all had increases under 1,000.
There was finally some better news on unemployment, with the rate dropping from 7.0 to 6.6% (there had been small declines of .1 % in August, September, and October). This is the first time since the start of the pandemic that New Jersey’s unemployment rate has been below 7%. We are still well higher than the national average (4.2%) but at least November showed some meaningful improvement. However, in contrast with the nation, where November saw a big drop in unemployment and a large increase in the labor force, New Jersey’s labor force was virtually unchanged (up a mere 700). The longer-term stagnation in New Jersey’s workforce (November’s level was under the 2008 average) remains baffling, even taking into account our sluggish population growth.

Tuesday, the US Bureau of Economic Analysis (BEA) issued data for 2020 “real” (price-adjusted) personal income and spending by state. Unsurprisingly, in 2020 New Jersey’s aggregate real income grew a bit less than the nation: 4.0% vs. 5.3%. This basically reflects the fact that the massive amount of pandemic aid was proportionately larger in lower-income states, and also that New Jersey was lagging in the start of our recovery. Real spending fell 4.1% here last year, which was about in line with the national decline of 3.8% (New York fell a staggering 7.0%, surely partly reflecting things like the shutdown of Broadway).
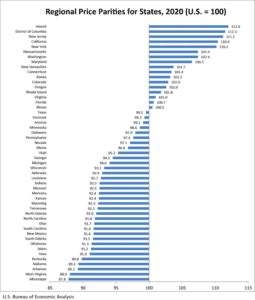
In order to compute real income by state BEA estimates state-level price indexes (which are measured relative to the national average and are called “price parities”). New Jersey stands out here, in an unfortunate way: New Jersey was estimated to have the highest 2020 price level of any of the lower 48 states (Hawaii and DC were both slightly higher). A big culprit was housing (housing cost estimates are based on rents, not purchase price): our index was about 40% higher than the national average (New York was actually a bit lower than us; Pennsylvania was more than 10% under the national average). Of course, housing costs in California were notably higher than in New Jersey, but our overall price index was a bit above theirs, reflecting steeper costs for other items, with utilities standing out: our utility costs were estimated to be about 5% higher than the national average, with both California and New York lower.
Our higher prices take a good part of the edge off our higher incomes. In dollars, New Jersey’s per capita income in 2020 ranked fifth in the nation (counting number 1 DC as a state) and was more than 20% above the national average When corrected for prices, per capita personal income in New Jersey in 2020 was a much reduced 11% above the national average, and our rank dropped to 7th. Surprisingly, the results for real after-tax per capita income aren’t much different—we ranked 8th, at about 9% higher than the nation (personal income figures are reported after property tax; the main items taken out to compute after-tax personal income are federal and state income taxes). In any event, the basics are clear: New Jersey is a very expensive place to live. While the per capita figures suggest that, on average, income here is sufficient to keep our heads about water, many of our residents earn much less than average, and our high prices worsens their situations.
